The Reverse Crocodile Effect: What Falling Shopping Ad Impressions and Rising CTR Really Mean

Written by
Aerin Kim
A September 2026 benchmark analysis found Shopping ad impressions falling while CTR climbs, nicknamed the reverse crocodile effect. Here is the honest, uncertain read on what it means.
If you have watched your Shopping or Performance Max click-through rate climb over the past year, it is tempting to read that number as a sign your feed, your bidding, or your creative finally clicked into place. A new benchmark analysis published on September 7, 2026 suggests a much less flattering explanation might be sitting underneath a lot of those improving CTR charts: Google's AI Overviews may be quietly reducing how often Shopping ads get shown in the first place, and a shrinking, more concentrated pool of impressions can push CTR upward all on its own, with no real improvement in the campaign at all.
The analysis comes from Mike Ryan, head of ecommerce at the benchmarking firm Smarter Ecommerce, published through the company's Market Observer research on September 7, 2026 and covered by Search Engine Land and Search Engine Roundtable, which gave the pattern its nickname: the "reverse crocodile effect." It is a genuinely interesting, timely, data-driven story, and also an unusually honest one. Ryan is direct that his own data does not prove AI Overviews are the cause of what he found, and that honesty is worth taking seriously rather than skimming past on the way to a headline.
This post walks through what the underlying numbers actually show, what the "reverse crocodile effect" name means and where it comes from, why Ryan's own caveats deserve a real section rather than a footnote, how this plays out differently depending on the kind of Shopping account you run, and a concrete, step-by-step way to check your own account this week instead of reacting to a trend line in isolation.
TL;DR
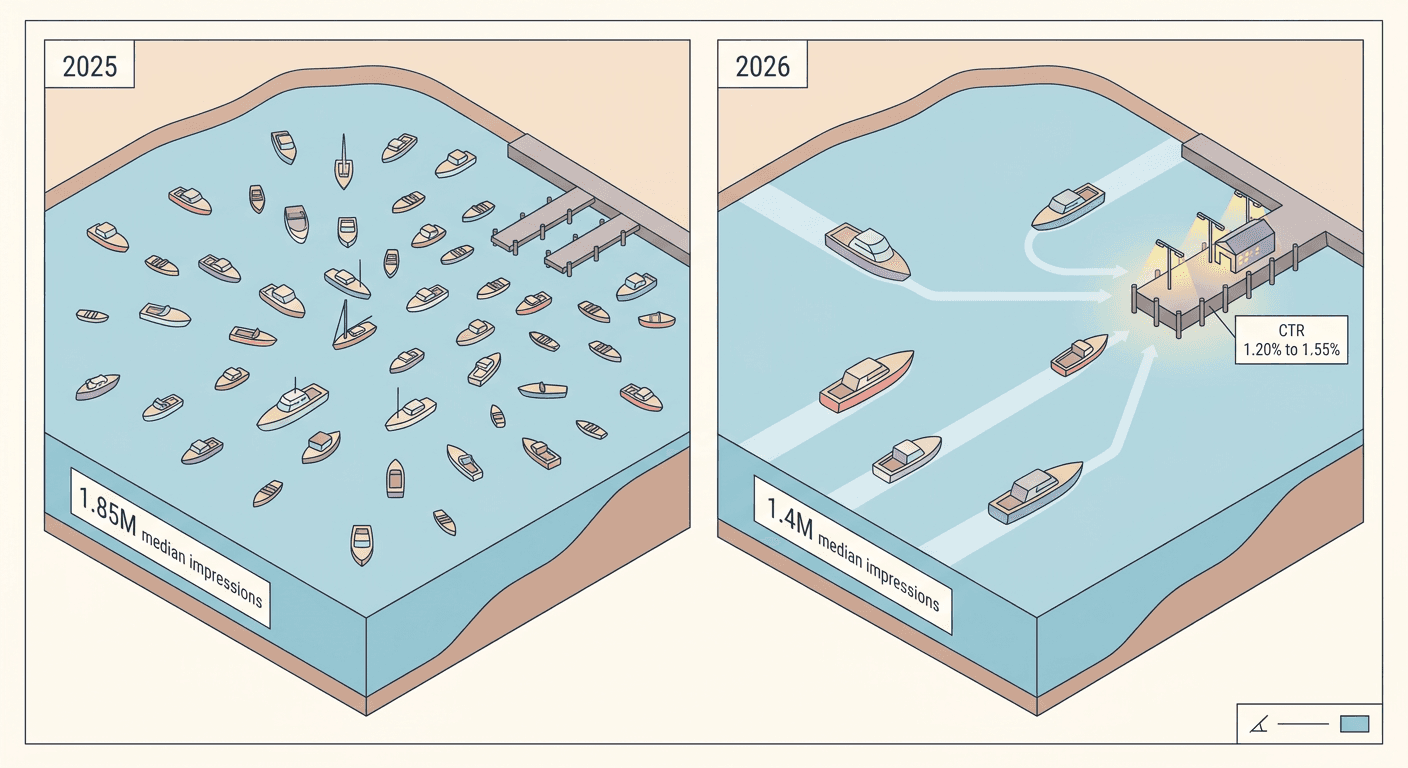
- A Smarter Ecommerce Market Observer analysis published September 7, 2026, drawing on roughly 175 billion impressions across thousands of Shopping and Performance Max campaigns spanning hundreds of advertiser accounts, found median Shopping ad impressions per account falling from roughly 1.85 million in mid-2025 to roughly 1.4 million in mid-2026, while median Shopping CTR rose from roughly 1.20% to nearly 1.55% over the same window. A separate, independent dataset from Optmyzr corroborated the direction with a roughly 17% CTR increase year over year.
- Clicks stayed relatively flat to only slightly down even as impressions fell more sharply, which is the actual mechanism worth understanding: ads are being shown less often, concentrated on a smaller set of queries that convert and click at a higher rate, which mechanically raises CTR without necessarily meaning the campaign itself is performing better.
- Search-industry press nicknamed this the "reverse crocodile effect" because it is the mirror image of the well-known "crocodile effect" in organic search, where AI Overviews gave publishers more impressions but fewer clicks. Shopping ads are showing the opposite shape: fewer impressions, held-up clicks.
- Ryan is explicit that this is a hypothesis, not a proven causal finding, and names real alternative explanations, including unrelated auction changes and a different underlying mechanism, worth walking through seriously rather than glossing over.
- The practical fix is not to stare at a CTR line. It is to pull absolute impressions, absolute clicks, and conversion volume for the same trailing window and read all three together, which is the only way to tell whether your account is actually shrinking, growing, or just being reshuffled toward a smaller, pricier slice of search demand.
- If Shopping and Performance Max impressions really are concentrating on a smaller, higher-intent audience, the ads that do get shown need to work harder per impression. That is a genuine, if secondary, reason to revisit the actual creative in your asset groups, including with tools like Miraflow's AI Image Generator and Cinematic AI Video Generator, covered in more detail later in this post.
What the Data Actually Shows
Start with what was actually measured, because the headline framing ("AI Overviews are hurting your Shopping ads") tends to compress three distinct numbers into one vague impression. Ryan's Market Observer analysis pulled data across thousands of Shopping and Performance Max campaigns, spanning hundreds of separate advertiser accounts, drawing on a dataset described as covering roughly 175 billion impressions. That is a large enough sample that the pattern is very unlikely to be pure noise from a handful of unusual accounts, even before getting into why it might be happening.
The core numbers, comparing mid-2025 to mid-2026, are laid out below.
| Metric | Mid-2025 | Mid-2026 | Source |
|---|---|---|---|
| Median Shopping ad impressions per account | ~1.85 million | ~1.4 million | Smarter Ecommerce Market Observer |
| Median Shopping ad CTR | ~1.20% | ~1.55% | Smarter Ecommerce Market Observer |
| Clicks | Baseline | Relatively flat to slightly down | Smarter Ecommerce Market Observer |
| Independent CTR benchmark, year over year | — | Up roughly 17% | Optmyzr (separate dataset) |
Three things stand out once you look at the three metrics together instead of just the CTR line.
First, the impression decline is the biggest single move in the dataset, a drop from roughly 1.85 million to roughly 1.4 million median impressions per account, a meaningfully large year-over-year fall for a metric that used to track fairly closely with overall Shopping demand and seasonal search volume. Second, the CTR increase, while real and independently corroborated by Optmyzr's separate 17% year-over-year figure, is a smaller move in relative terms than the impression drop. Third, and this is the detail that actually explains the other two, clicks themselves stayed relatively flat to only slightly down. That third number is the one that makes this genuinely interesting rather than just "ads doing worse." If impressions fall sharply but clicks barely move, the arithmetic of CTR (clicks divided by impressions) means CTR has to rise, and it does not require any real improvement in ad quality, bidding, or creative to produce that rise. A smaller denominator with a similar numerator is enough on its own.
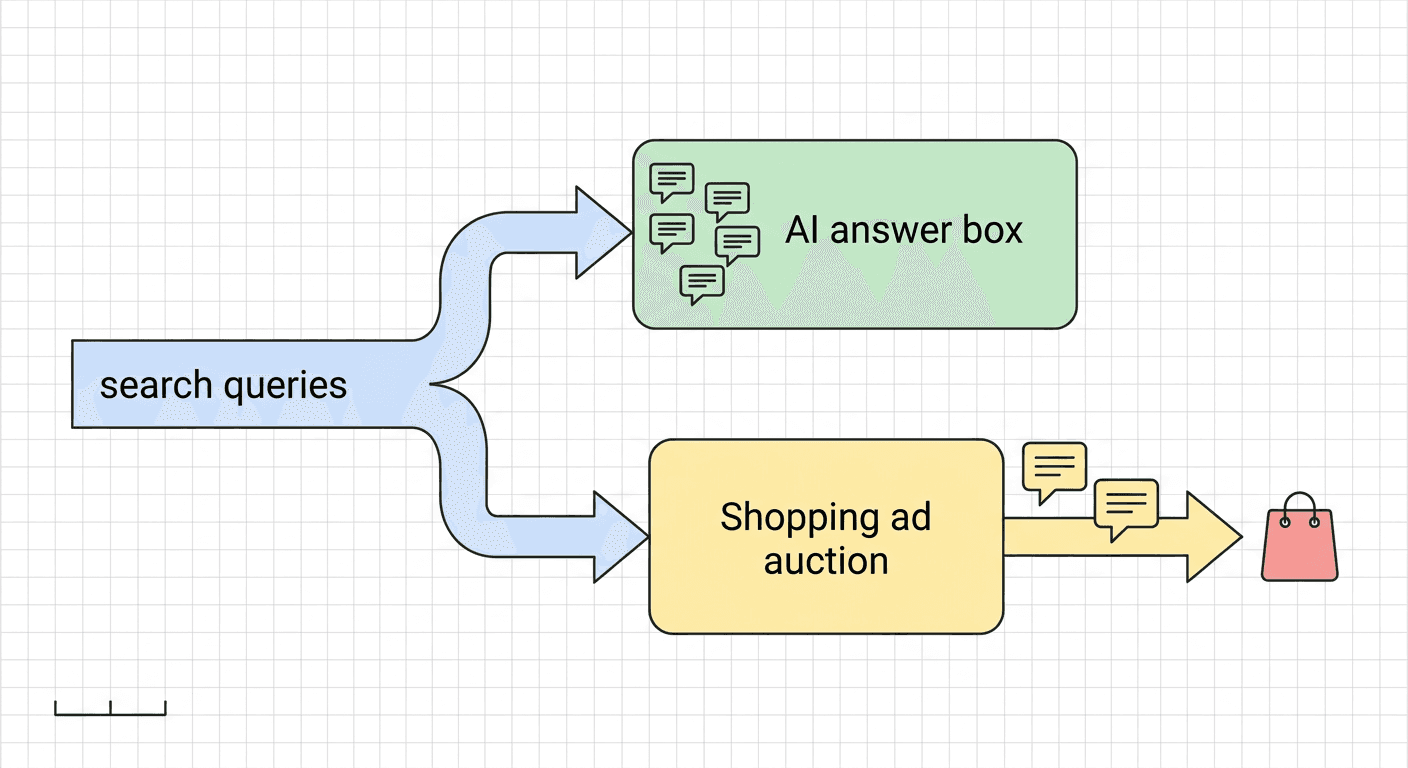
Ryan's own read of what is happening underneath those numbers is that AI Overviews appear to be absorbing or resolving a share of lower-intent, more informational, shopping-adjacent queries directly inside the AI-generated answer itself, so a Shopping ad simply never gets triggered on that slice of search volume anymore. According to the analysis, Google's serving logic behind this involves checking a query's predicted click-through probability and preferentially serving an AI Overview for lower-probability queries, a way of preserving ad revenue by not spending impression inventory on searches that were unlikely to convert into an ad click anyway. What is left, on the queries where a Shopping ad still shows, is a smaller pool that skews toward higher purchase intent on average, and higher-intent traffic naturally clicks and converts at a higher rate. That is not a change in how good your ad is. It is a change in which slice of demand your ad is even competing for.
It helps to make this concrete with a plain example. Picture a mid-sized home goods retailer whose Shopping campaign used to show for a wide mix of queries: "best cast iron skillet," "cast iron skillet vs stainless steel," "how to season a cast iron pan," and "buy 12 inch cast iron skillet." A meaningful share of that volume was genuinely informational, someone comparing options or learning how to use a product they might buy weeks later, not someone with a card out ready to purchase in the next few minutes. If Google's AI Overview now answers the comparison and how-to queries directly inside the search results page, the retailer's Shopping ad stops competing for those impressions at all. It is still shown, and still competitive, for "buy 12 inch cast iron skillet" and similar high-intent variants. Total impressions fall because a real chunk of the query mix disappeared from the ad auction entirely. Clicks barely move because the queries that vanished were never converting into many clicks to begin with. CTR rises because the math of a smaller, higher-quality denominator works out that way, not because the retailer's account got better at anything.
This mechanism, if it is the real explanation, is a genuinely different kind of problem than a typical Google Ads platform change. It is not a new bidding strategy, a new campaign type, or a policy update with a clear before-and-after switch. It is a possible shift in which slice of search demand ever reaches the auction at all, happening gradually and invisibly inside Google's own ranking and serving decisions, which is exactly why it took a large-scale benchmark analysis across hundreds of accounts, rather than any single advertiser noticing something in their own dashboard, to even surface the pattern.
What Is the "Reverse Crocodile Effect"? (And How It Differs From the Original)
The nickname search-industry press gave this pattern only makes sense once you know the term it is borrowing from, and most Google Ads readers have not encountered the original version, which lives mostly in SEO and organic-search circles.
The original "crocodile effect," sometimes also called the "great decoupling," describes a pattern search analysts noticed in organic publisher traffic after AI Overviews rolled out broadly. A publisher's page might still show up, and even show up more often, inside the sources cited or linked from an AI Overview answer. Impressions on that page, measured through Google Search Console, actually went up in a lot of cases. But clicks through to the actual page went down, because a growing share of searchers got their answer directly from the AI-generated summary and never felt the need to click through to the source at all. When you plot impressions rising and clicks falling on the same chart over time, the two lines pull apart from each other in a shape that looks, if you squint, like the open jaws of a crocodile: one line arcing up, the other arcing down, the gap between them widening the further right you go on the timeline. That visual is where the name comes from, and it captured something real and painful for publishers: more visibility, on paper, paired with less actual traffic.
Shopping ads, according to Ryan's analysis, are showing the mirror image of that shape, which is exactly why "reverse crocodile" is an apt name rather than just a catchy label. Instead of impressions rising while clicks fall, Shopping ad impressions are falling while clicks hold roughly steady. Plot those two lines and they do not pull apart into an open jaw. They compress toward each other, impressions dropping down toward the click line rather than clicks dropping away from impressions. The jaw is closing rather than opening, which is the literal reverse of the original pattern, not just a vaguely related side effect of the same AI Overviews rollout.
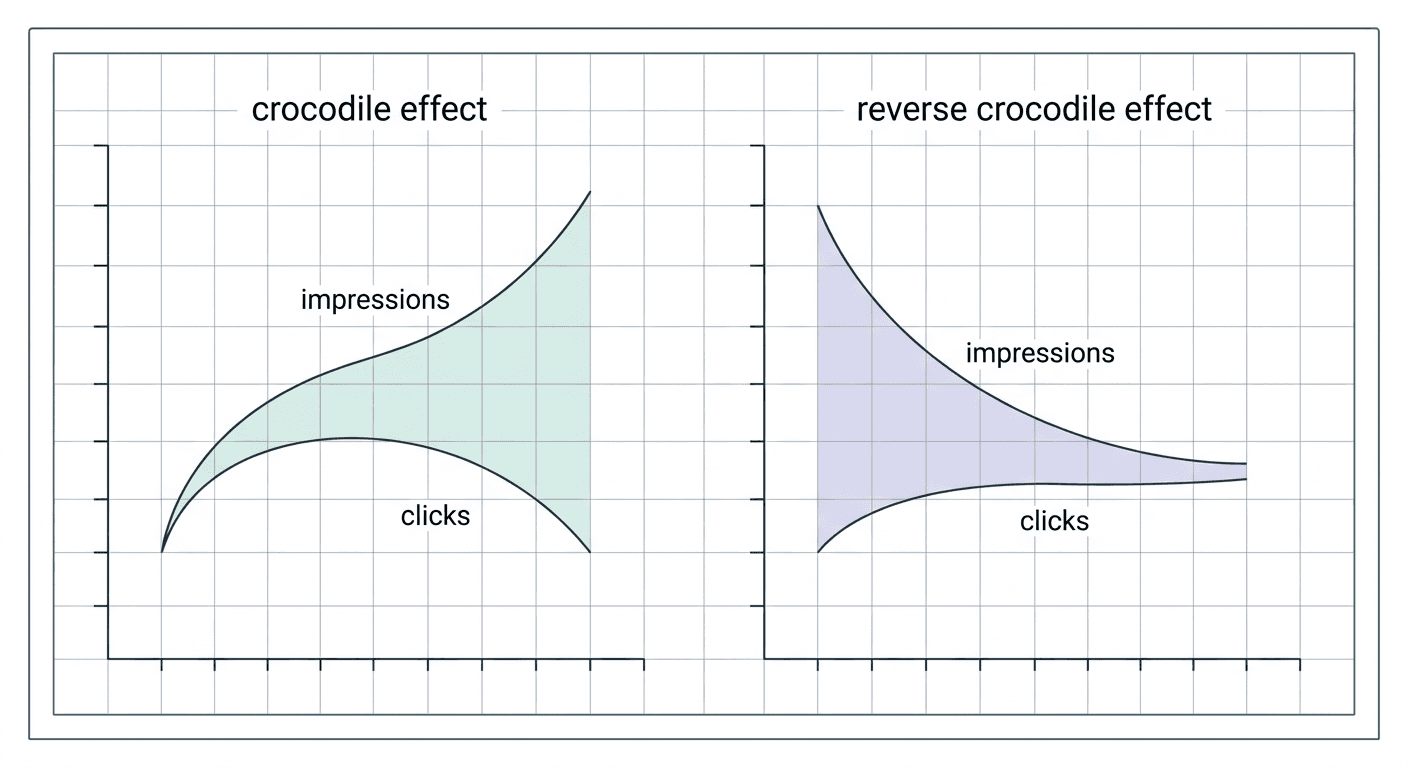
The distinction matters for more than trivia value. The original crocodile effect was primarily bad news wrapped in a deceptively good-looking impressions number, a publisher could look at rising impressions and feel encouraged right up until they checked their actual traffic and revenue. The reverse crocodile effect inverts that trap in the opposite direction: it is a genuinely ambiguous number wrapped in what looks like unambiguous good news. A rising CTR is the kind of metric most advertisers are trained to celebrate on sight, and Google Ads' own UI will often highlight a CTR improvement in green without any commentary on whether the underlying impression volume shrank to produce it. Recognizing this as the reverse of a documented, already-studied phenomenon rather than an isolated anomaly is itself useful, because it means the pattern likely has some retrievable structure and mechanism behind it (a shift in which queries reach the ad auction at all) rather than being pure noise or an unrelated auction fluctuation.
It is also worth being honest about what has not been shown yet. The original crocodile effect has been documented across a fairly wide range of publisher categories and has had well over a year of ongoing analysis and refinement behind it. The reverse crocodile effect, as of this September 2026 analysis, is a single large benchmark study, corroborated in direction by one additional independent dataset from Optmyzr, covering one specific ad format over one specific year-over-year window. That is a meaningfully earlier stage of evidence than the original term it borrows its name from, and treating the two as equally well-established would overstate what is actually known so far.
The Honest Uncertainty: Three Reasons This Might Not Be AI Overviews At All
This is the section most coverage of a data story like this tends to compress into a single throwaway sentence, and it deserves better, because Ryan's own framing of his findings is unusually careful and worth walking through in full rather than skipping to the conclusion.
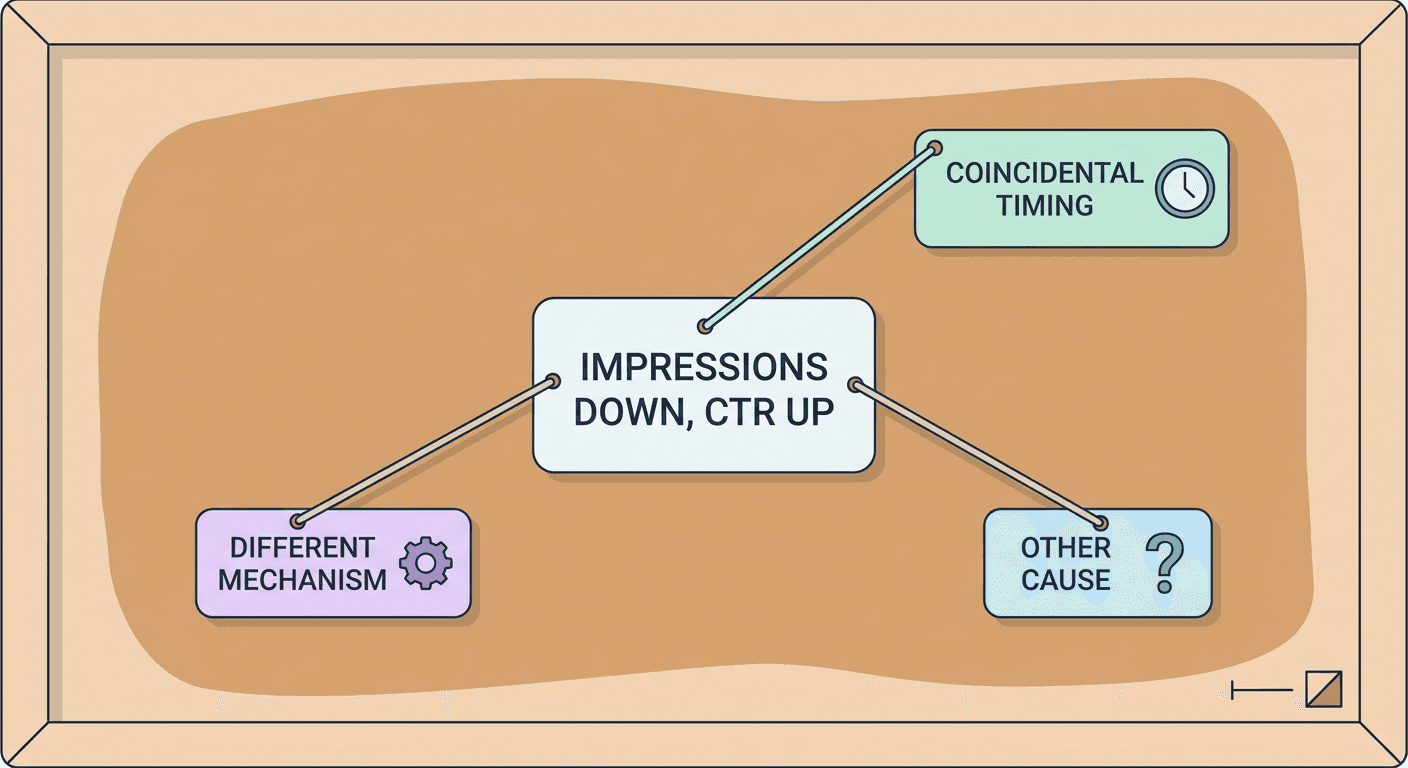
Ryan states directly that "the data doesn't prove AI Overviews are causing the change." That is not hedging for legal safety. It is an accurate description of what a correlational benchmark analysis across a 12-month window can and cannot establish, and Ryan names three concrete alternative explanations rather than leaving the uncertainty vague.
The timing could be coincidental with other auction or algorithm changes. Google runs a constant stream of Shopping and Performance Max auction adjustments, quality-score model updates, and ranking changes that have nothing to do with AI Overviews at all. A 12-month window that happens to overlap with the broader AI Overviews rollout also overlaps with a dozen other things Google shipped during the same period, any one of which could independently shift impression volume, auction eligibility, or click behavior. Correlation across a single overlapping timeframe, no matter how large the sample, cannot rule out a confound this obvious on its own.
AI Overviews could be affecting the numbers through a different mechanism than the one hypothesized. Ryan's working theory, that Google is preferentially serving AI Overviews on lower-predicted-CTR queries and pulling Shopping ad eligibility down with it, is a specific, testable mechanism, but it is one hypothesis among several plausible ones. AI Overviews could instead be changing user query behavior itself, shifting how people phrase searches in ways that indirectly affect which auctions Shopping ads qualify for, rather than directly suppressing ad eligibility on specific query types. The observed effect, fewer impressions and steadier clicks, could be consistent with more than one underlying causal story, and this analysis cannot yet distinguish between them.
Something else entirely could be responsible. Ryan leaves room for causes outside both AI Overviews and routine auction tuning altogether: a shift in overall consumer search behavior, a change in how a large platform-level advertiser segment is bidding, or a category-specific demand shift that happens to be large enough to move a median figure across hundreds of accounts. A benchmark analysis, however large, is observing an outcome, not running a controlled experiment that isolates one candidate cause from every other one operating in the same market at the same time.
Ryan's own summary of all this is that it remains "a hypothesis," not a proven causal finding, and that framing is itself the most useful part of the whole analysis for a working advertiser to internalize. A hypothesis backed by 175 billion impressions of real data and corroborated in direction by an independent dataset is a genuinely strong hypothesis, well worth acting on with caution. It is a categorically different thing than a confirmed platform mechanism you could safely explain to a client as settled fact. The single most valuable habit a reader can take from this story is treating "impressions fell, CTR rose, and here is one plausible reason why, unconfirmed" as a complete and honest sentence, rather than compressing it down to "AI Overviews are killing your Shopping impressions" the way a lot of secondary coverage of a story like this tends to.
Why This Matters Differently Depending on Your Account
A benchmark built from median values across hundreds of accounts describes a center of gravity, not any single advertiser's actual situation. How much this pattern should change your own week-to-week monitoring depends heavily on what kind of Shopping or Performance Max account you actually run.
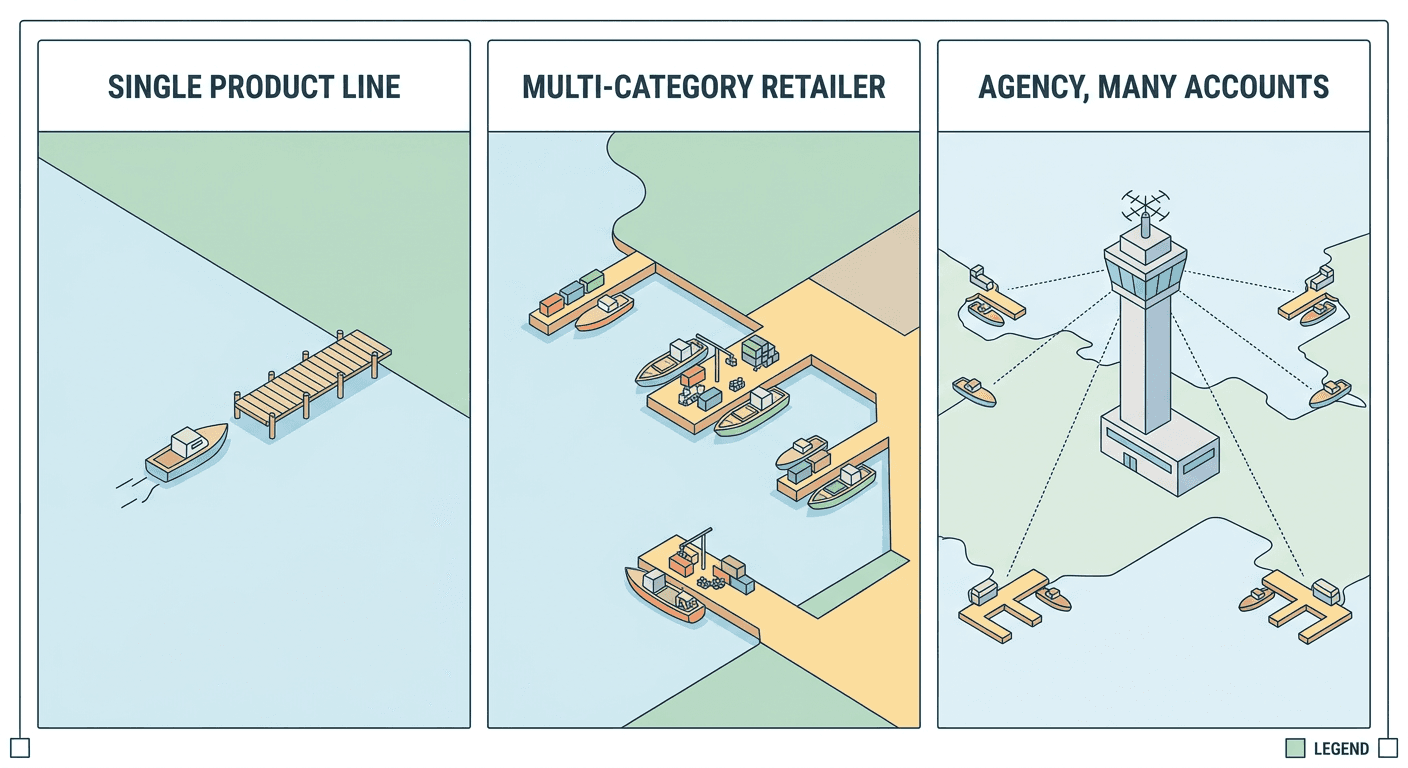
A small, single-product-line advertiser is the case where this pattern is easiest to read, for better or worse. If you sell one core product category, say a single line of skincare products or one brand of outdoor gear, your query mix is naturally narrower to begin with, and a shift toward higher-intent queries is likely to show up cleanly in your own reporting without much noise from unrelated categories diluting the signal. The metric to watch closely here is absolute click and conversion volume over a trailing 90-day window compared to the same period a year earlier, not CTR. If your CTR is rising but your absolute conversion count is flat or down over that same window, the reverse crocodile pattern, or something with a similar shape, is a plausible explanation worth investigating rather than assuming your product or creative got worse. If both CTR and absolute conversions are rising together, the improvement is more likely genuine and less likely to be an artifact of shrinking impression volume.
A large, multi-category retailer faces a messier picture but arguably more at stake. A retailer running Shopping campaigns across dozens of product categories, apparel, electronics, home goods, and more, is very likely to see this pattern hit categories unevenly rather than uniformly. Categories with a naturally high share of comparison and how-to search behavior, electronics and appliances are a common example, are more exposed to AI Overviews absorbing informational queries than a category where nearly every search already carries clear purchase intent, replacement parts or consumables being a common example of the latter. The metric to watch here is category-level impression and click trends segmented individually, not a single blended account-level CTR number, which can hide a meaningful decline in one category behind stability or growth in another. A retailer that only checks its top-line account CTR risks missing a real, category-specific impression collapse happening quietly inside one line of business while the rest of the account looks fine.
An agency managing many Shopping accounts has the broadest exposure and the clearest reason to treat this as a standing process rather than a one-time check. Across a client roster spanning different verticals, some clients will show the reverse crocodile pattern clearly, some will show a milder version of it, and some will show no meaningful change at all, and an agency needs a consistent way to tell the difference across dozens of accounts rather than eyeballing each client's dashboard individually. The practical move is building a lightweight recurring report, even a simple spreadsheet pulled monthly from the Google Ads API or export tool, that tracks the same three numbers (impressions, clicks, conversions) side by side for every client account rather than relying on the CTR trend line the Google Ads UI surfaces most prominently by default. This also puts an agency in a strong position heading into client conversations: being able to say "your CTR is up, but so is your click and conversion volume, so this looks like a genuine improvement" or conversely "your CTR is up, but impressions and clicks both fell, so let's look at what queries you're losing" is a meaningfully more credible, defensible conversation than reacting to a single headline metric.
What to Actually Check in Your Own Account This Week
None of the analysis above is useful if it stays theoretical. Here is a concrete, step-by-step way to check whether your own account shows anything resembling the reverse crocodile pattern, using tools already available inside Google Ads.
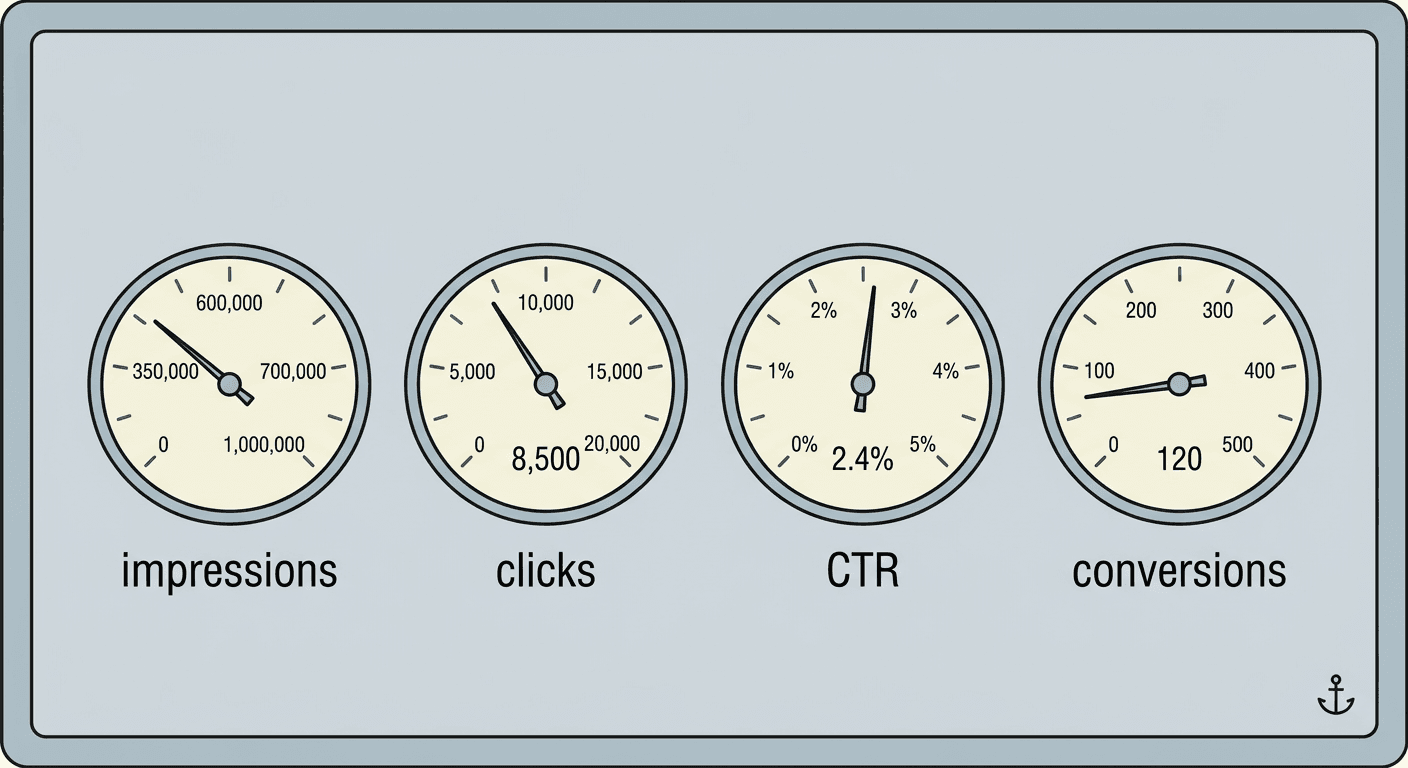
Step 1: Pull impressions, clicks, CTR, and conversions for the same trailing window, year over year. Use the Google Ads UI's date comparison feature, or export the data if you manage the account through a script or third-party tool, and compare a recent 90-day window against the same 90-day window a year earlier. A shorter window risks catching seasonal noise; a full 90 days smooths out week-to-week fluctuation while still being recent enough to reflect current auction dynamics.
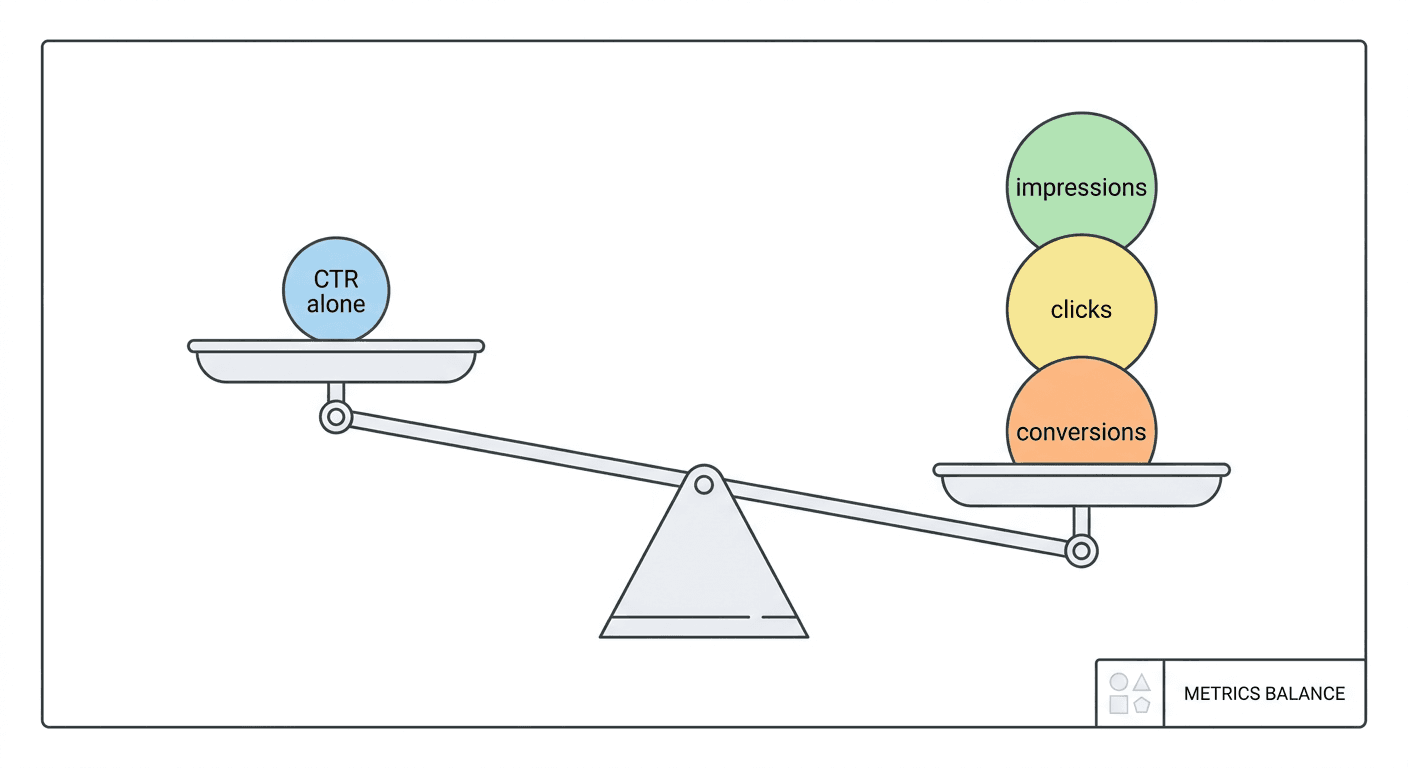
Step 2: Look at the four numbers together, not CTR in isolation. Build a simple table with four columns, impressions, clicks, CTR, and conversions, for both time windows side by side. The pattern worth flagging looks like this: CTR rising, impressions falling by a larger relative amount than clicks, and conversions roughly flat or down despite the rising CTR. If instead impressions, clicks, and conversions are all rising together alongside CTR, you are very likely looking at a genuine account improvement, not the reverse crocodile pattern.
Step 3: Segment by product category or query theme if your account spans more than one. As covered above, this pattern is unlikely to hit every category evenly. Break the same four-number comparison out by product category inside Performance Max reporting, or by Shopping campaign if you run separate campaigns per category, rather than relying on one blended account total that can mask a real decline in one line of business.
Step 4: Check your search terms report for a shrinking mix of informational queries. If your account still runs Shopping with visible search term data, or a Performance Max campaign with search theme insights enabled, look specifically for whether comparison, "vs," "how to," "best," and "review" style queries make up a smaller share of your total query volume now than they did a year ago. A meaningfully shrinking share of informational query types alongside the impression and CTR pattern above is a specific, checkable signal consistent with Ryan's hypothesized mechanism, rather than just a generic auction fluctuation.
Step 5: Check impression share lost to rank and lost to budget separately. Google Ads' own impression share metrics can help rule out a much more mundane explanation before reaching for an AI Overviews story at all. If impression share lost to budget rose meaningfully over the same window, your own budget constraints, not any change in Google's serving behavior, may be the real reason impressions fell. If impression share lost to rank rose instead, a competitive or quality-score shift inside the auction itself is a more likely driver. Only once both of those look stable is the AI Overviews hypothesis the more likely remaining explanation for a genuine impression decline.
Step 6: Compare your own numbers against the reported benchmark, but treat it as context, not a verdict. If your account's mid-2025 to mid-2026 numbers land somewhere near the reported medians, roughly a 20 to 25% impression decline alongside a CTR rise with flat clicks, that is a meaningful data point suggesting your account is part of the broader pattern rather than an isolated anomaly. If your numbers look nothing like that, trust your own account's actual data over a median figure drawn from hundreds of other advertisers whose category mix, geography, and bidding strategy may differ substantially from yours.
The Lever You Still Control: Creative and Asset Quality
Here is the part of this story that is easy to miss while focused on causation and Google's serving logic: if the underlying mechanism Ryan describes is real, even partially, the practical consequence for advertisers is not purely negative. A smaller, more concentrated pool of higher-intent impressions means the auction you are actually competing in now matters more per impression, not less. Winning that narrower, pricier slice of attention with genuinely strong creative is a higher-leverage move today than it was when your ad was also competing, less consequentially, for a wide pool of lower-intent browsers who were unlikely to convert regardless of how good your product image looked.
This is true regardless of whether the AI Overviews hypothesis ends up being confirmed, partially right, or eventually replaced by a better explanation. Query volume genuinely reaching the Shopping and Performance Max auction, whatever the cause, skews more toward people closer to a purchase decision than it may have a year ago. A shopper who is that close to converting, comparing two or three specific listings before clicking, is exactly the shopper who notices whether your product image looks current, well-lit, and trustworthy next to a competitor's, and whether your Performance Max asset group includes a short video that actually shows the product in use rather than a single static photo repeated across every placement.
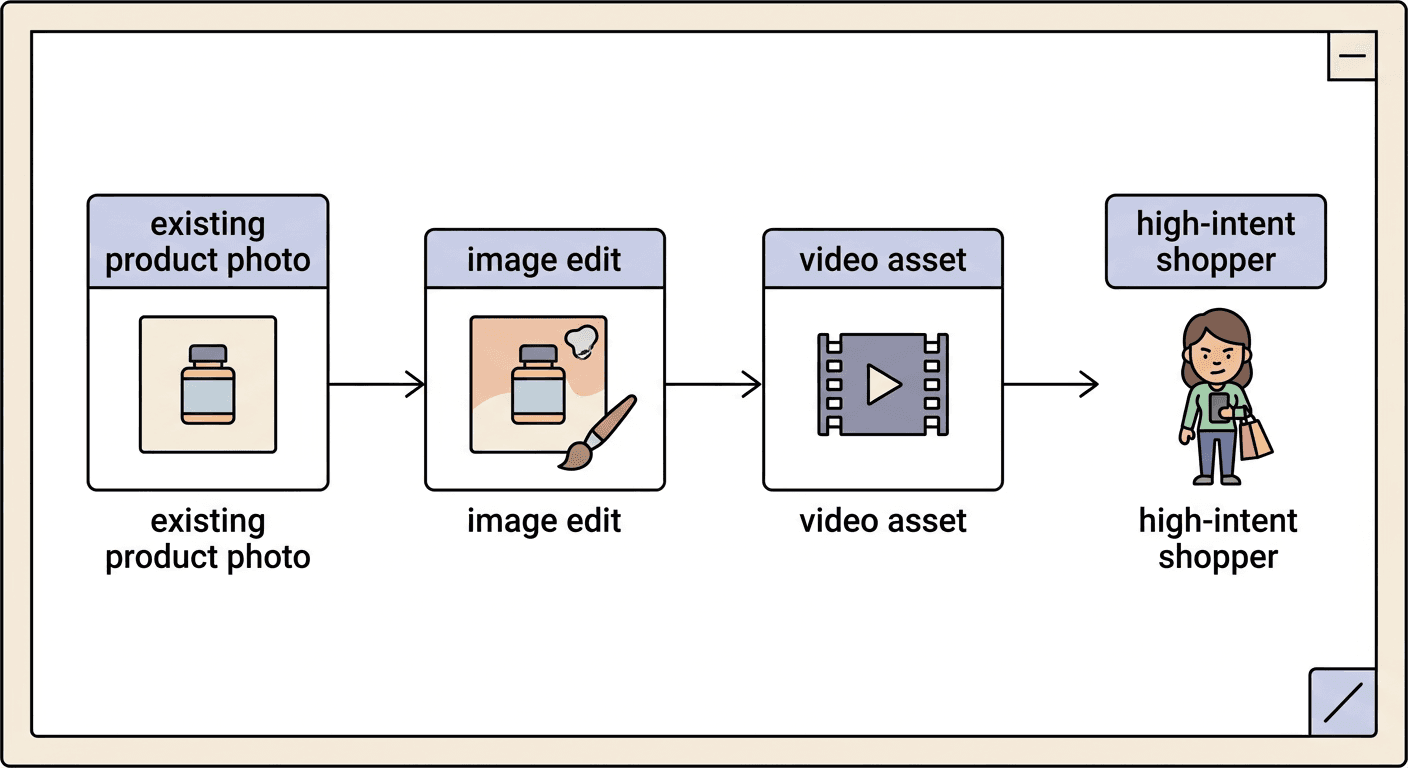
This is a natural, honest place for Miraflow's own tools to fit into a Shopping or Performance Max advertiser's actual workflow, not as a forced tie-in but as a genuine answer to the creative side of the problem this data raises. Miraflow's AI Image Generator supports image-to-image editing and inpainting, which means an existing product photo can be refreshed selectively: swapping a dated background for a clean studio setting, updating a product's staged color or seasonal styling, or replacing a cluttered scene behind the product without commissioning an entirely new photoshoot for every listing update. For an advertiser managing dozens or hundreds of SKUs across a Merchant Center feed, that speed matters, since keeping every listing's imagery current against a shrinking, higher-intent pool of shoppers is a very different task than doing an annual photo refresh once a year.
Video is the other half of this. Performance Max asset groups reward having genuine video creative, not just images, and a lot of advertisers still ship Performance Max campaigns with zero video assets simply because producing one used to require booking a shoot, an editor, and real turnaround time. Miraflow's Cinematic AI Video Generator turns a written prompt into a polished clip without that production overhead, which makes it realistic to actually produce a new video asset for a seasonal push or a specific product launch rather than leaving the same static images running for months at a time. Neither tool replaces solid photography and video production entirely, and neither one changes anything about the auction dynamics described earlier in this post. What they do is lower the cost of actually acting on the conclusion this data points toward: if your Shopping ads are being shown to fewer, higher-value people, make sure those people see the best version of your product the moment your ad appears.
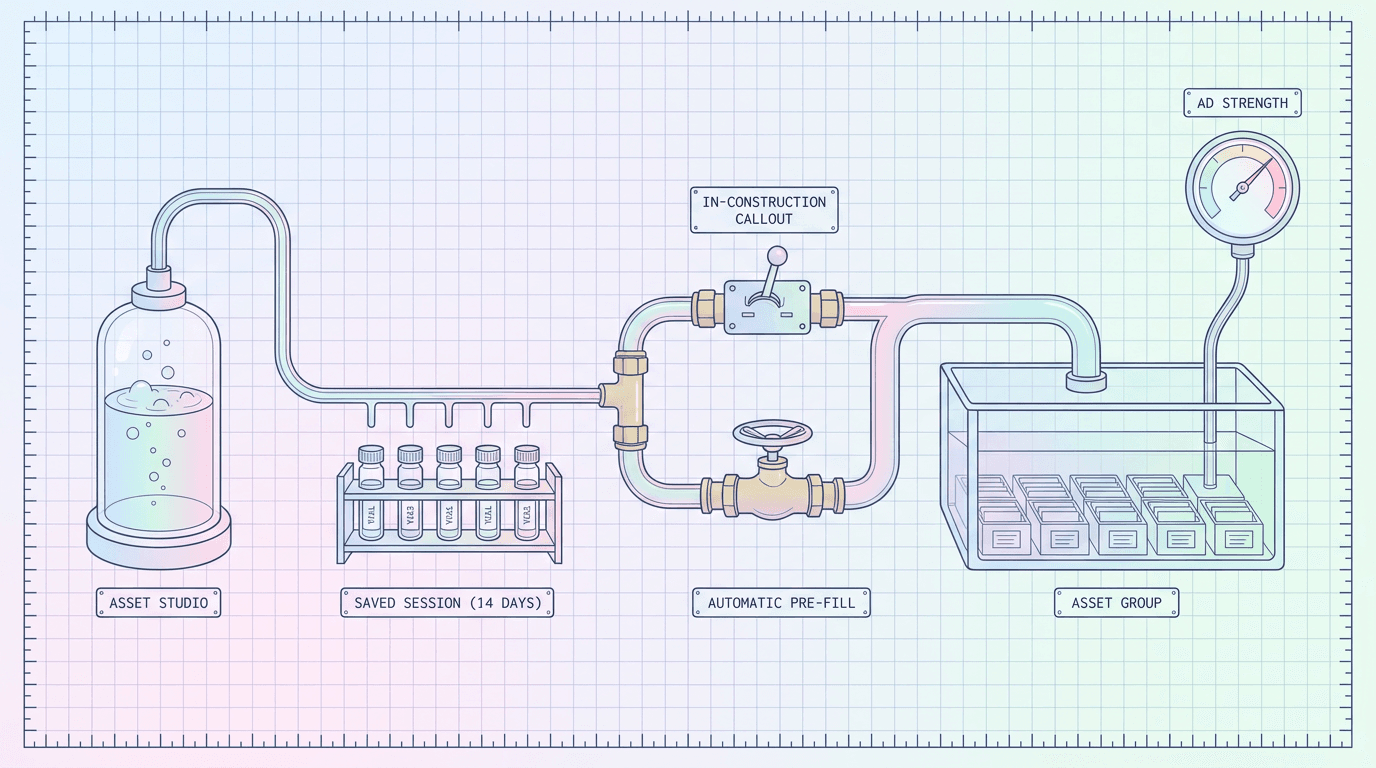
It is worth reading this alongside a couple of other recent Performance Max creative and asset changes covered on the Miraflow blog, including how Gemini Omni inside Asset Studio is changing video asset production directly inside Google Ads, and the Performance Max Asset Studio prefill update, since Google itself has clearly been investing in making creative refresh easier at the same time this impression and CTR pattern has been showing up, which is not a coincidence worth ignoring.
Common Mistakes
Treating a rising CTR as proof of a healthier campaign without checking absolute impression and click volume. This is the single mistake this entire post exists to prevent. CTR is a ratio, and a ratio can rise because the numerator grew, because the denominator shrank, or some mix of both. Only checking the ratio itself, which is exactly what a quick glance at the Google Ads dashboard encourages, throws away the information needed to tell those cases apart.
Overselling the AI Overviews explanation as a confirmed fact in client reports or internal decks. Ryan's own framing is careful and conditional. Repeating "AI Overviews are suppressing your Shopping impressions" as settled fact to a client or a manager overstates what the current evidence actually supports, and risks a credibility problem later if a better explanation emerges. The accurate, still genuinely useful version is "a large benchmark analysis found a pattern consistent with this hypothesis, and here is what our own account's data shows relative to it."
Comparing CTR against last year's benchmark without adjusting for query mix changes. If the mix of queries reaching your auction has shifted meaningfully toward higher-intent terms, a flat or improving year-over-year CTR comparison is comparing two genuinely different populations of searches, not measuring the same thing twice. A category-level or query-theme-level comparison is more honest than a single blended year-over-year CTR number.
Ignoring impression share lost to budget and lost to rank before jumping to an AI Overviews explanation. A budget-constrained account or one losing rank to a newly aggressive competitor can produce a very similar-looking impression decline for reasons that have nothing to do with AI Overviews at all, and those are both problems with far more direct, actionable fixes than a platform-level search behavior shift.
Cutting Shopping or Performance Max budget reactively based on a falling impression count alone. If the underlying cause really is a narrowing toward higher-intent queries, the remaining impressions may be genuinely more valuable per dollar than the informational-query impressions that disappeared, even though the total impression count looks worse on a surface-level dashboard. Pulling budget in response to raw impression count without checking conversion volume and value risks cutting spend on the exact traffic that is actually converting best.
Leaving creative untouched while assuming the algorithm alone will handle a smaller, higher-intent audience well. A narrower, pricier auction rewards strong creative more, not less. Running the same static product photos and zero video assets you had a year ago, while the pool of people actually seeing your ad has become smaller and closer to a purchase decision, leaves real conversion rate on the table regardless of what Google's serving logic is doing behind the scenes.
Frequently Asked Questions
What is the reverse crocodile effect in Google Ads?
It is a nickname search-industry press gave to a pattern identified in a September 2026 Smarter Ecommerce Market Observer analysis, where median Shopping ad impressions fell roughly from 1.85 million to 1.4 million per account between mid-2025 and mid-2026, while median Shopping CTR rose from roughly 1.20% to nearly 1.55% over the same window, with clicks staying relatively flat. It is called "reverse" because it is the mirror image of the earlier, already-documented "crocodile effect" in organic search, where AI Overviews were associated with rising impressions and falling clicks for publishers.
Is it proven that AI Overviews are causing this?
No, and the analyst behind the finding, Mike Ryan of Smarter Ecommerce, says so directly. He states the data does not prove AI Overviews are causing the change, and names coincidental timing with unrelated auction changes, a different underlying mechanism than the one hypothesized, or another cause entirely as real alternative explanations. He describes it as a hypothesis, not a confirmed causal finding.
How large was the dataset behind this analysis?
The Smarter Ecommerce Market Observer analysis drew on a dataset described as covering roughly 175 billion impressions across thousands of Shopping and Performance Max campaigns spanning hundreds of separate advertiser accounts, comparing figures from mid-2025 to mid-2026. A separate, independent dataset from Optmyzr corroborated the direction of the CTR change with a roughly 17% year-over-year increase.
Should I be worried if my own account's CTR is rising right now?
Not automatically. A rising CTR is only a concern if it is paired with falling absolute impressions and clicks that are flat or down, and ideally flat or falling conversion volume as well. If your impressions, clicks, and conversions are all rising together alongside CTR, that is a strong sign of genuine improvement rather than the pattern described in this analysis. Check the four numbers together rather than reacting to CTR alone.
Does this affect all Shopping and Performance Max categories equally?
The available evidence does not suggest that, and there is good reason to expect it would not. Categories with a naturally higher share of comparison, review, and how-to style search behavior are more exposed to AI Overviews absorbing informational queries than categories where nearly every search already reflects clear purchase intent. A multi-category retailer should check this at the category level rather than relying on one blended account-wide number.
What should I actually do differently in my account this week?
Pull impressions, clicks, CTR, and conversions for a trailing 90-day window compared to the same window a year earlier, check impression share lost to rank and lost to budget to rule out more mundane explanations, and segment by category if your account spans more than one. If the pattern described in this post shows up in your own data, treat it as a reason to double down on creative quality for the narrower, higher-intent audience you are still reaching, rather than an automatic reason to cut budget.
Will this change how I should set up Performance Max campaigns?
Not in terms of campaign structure or bidding strategy directly, since this is a pattern in query eligibility and volume rather than a new platform feature or setting. It is a reason to prioritize strong, current creative assets, product imagery and video that actually show your product well, since a smaller, more valuable pool of impressions rewards strong creative more heavily than a larger, more diluted one did.
Conclusion
The most useful thing about this story is not the specific numbers, real and well-corroborated as they are. It is the model of how to read your own account data that it demonstrates. A rising CTR looks like good news on sight, and Google Ads' own interface is built to present it that way, in green, without commentary on the impression volume underneath it. Mike Ryan's analysis, and just as much his honesty about its limits, is a genuine example of how to treat a real, uncertain pattern in advertising data as exactly that: worth taking seriously, worth checking against your own account, and not yet worth repeating as settled fact.
If your own Shopping or Performance Max account shows a version of the pattern described here, falling impressions, flat-to-slightly-down clicks, and a CTR that looks better than it actually is, the right response is not panic and it is not blind celebration. It is checking the four numbers together, segmenting by category if you run more than one, ruling out budget and rank constraints first, and then treating a narrower, higher-intent audience as a reason to sharpen your creative rather than coast on the assumption that the algorithm alone will make the most of a smaller opportunity. A quick refresh through Miraflow's AI Image Generator for updated product photography, or a new clip from the Cinematic AI Video Generator for a Performance Max video asset group that has been running the same static images for months, is a concrete, low-effort way to make sure the fewer people who do see your ad actually convert at a higher rate, regardless of how the AI Overviews question eventually gets resolved.
For more on how Google Ads has been reshaping Shopping and Performance Max heading into the 2026 holiday season, the Miraflow blog has recent breakdowns worth reading alongside this one, including Local Customer Optimization and Store Sales in Data Manager, the shift toward Local Inventory Ads as a Shopping default, and the AI Mode exact and phrase match test, which together paint a picture of a platform making a lot of smaller, connected changes to how ads and AI-driven search surfaces interact, rather than one single isolated update. You can explore the rest of Miraflow's AI content tools, including the AI Image Generator and Cinematic AI Video Generator covered above, from the Miraflow homepage.