Google Ads AI Max Reporting Changes: Every New Column Explained (September 2026)

Written by
Aerin Kim

AI Max's September 2026 migration quietly rewrote six Google Ads reports. Here is every new column, every new row, and what disappeared, explained with real examples.
Somewhere between September 1 and September 30, 2026, Google finished sliding a large share of Search campaigns onto AI Max, whether the account owner logged in that month or not. If you already read about the mechanics of that auto-upgrade, the broad match and Automatically Created Assets campaigns getting folded in, the brand and text controls, the February 2027 runway for Dynamic Search Ads, you know the "what" and the "why." What almost nobody has walked through yet is the part that actually shows up on your screen the next time you open a report: the columns that changed, the rows that appeared out of nowhere, and the ones that quietly went blank.
That is the gap this post fills. Between roughly September 1 and September 21, 2026, six separate reporting surfaces inside Google Ads changed shape because of the AI Max migration: the Search Terms report, the Keyword report, the Landing Page report, the Asset report, and the Network breakdown on Performance Max. None of these are cosmetic tweaks. Each one changes what a number actually means the moment you read it, and at least one of them, the Asset Performance Label disappearing, has already tricked advertisers into thinking Google stopped tracking their creative entirely. If your reports look different this week and you cannot quite say why, this is the reference to bookmark.
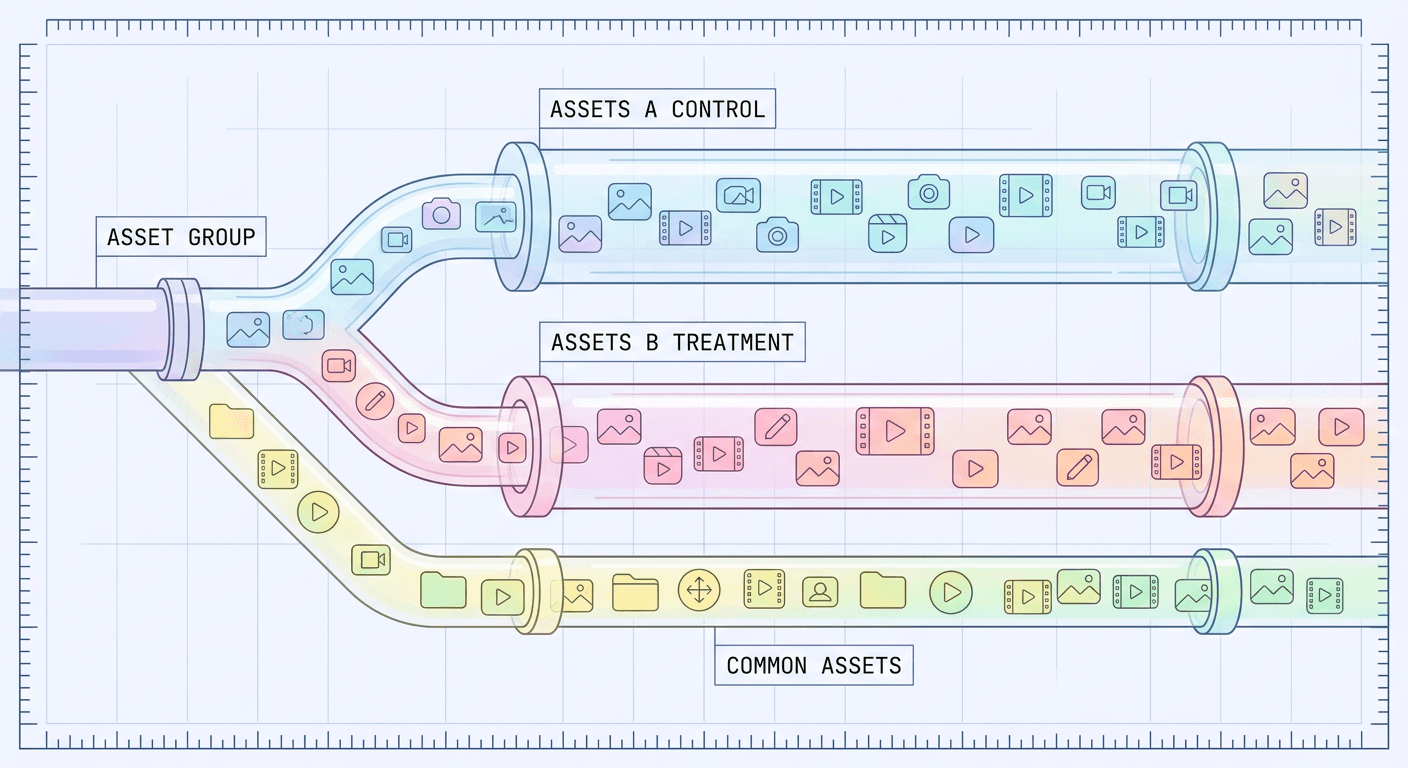
One practical note before the reporting deep dive: several of these changes put more scrutiny on the actual assets AI Max is drawing from, since the system is now generating headlines and choosing landing pages based on what you have given it to work with. If your image library feeding Search, Performance Max, or Demand Gen campaigns is thin, this is also a good week to refresh it. Miraflow's AI Image Generator produces on-brand product and lifestyle imagery in minutes, and the Cinematic AI Video Generator handles the video assets that feed Performance Max and Demand Gen asset groups, both useful once you can actually see, thanks to the new reporting, which channels and which assets are doing the real work.
Here is the quick reference before the full walkthrough below, five reports, what they used to show, and what they show now.
| Report | Before the migration | After the migration |
|---|---|---|
| Search Terms report | Match type showed only Broad, Phrase, or Exact. No way to tell keyword-based expansion apart from keywordless matching. | New Sources column (Landing pages and URL inclusions vs. AI Max expanded matches) plus AI Max as its own match type. New combined "Search terms and ad combinations" view shows the search term with the exact headline and URL served. |
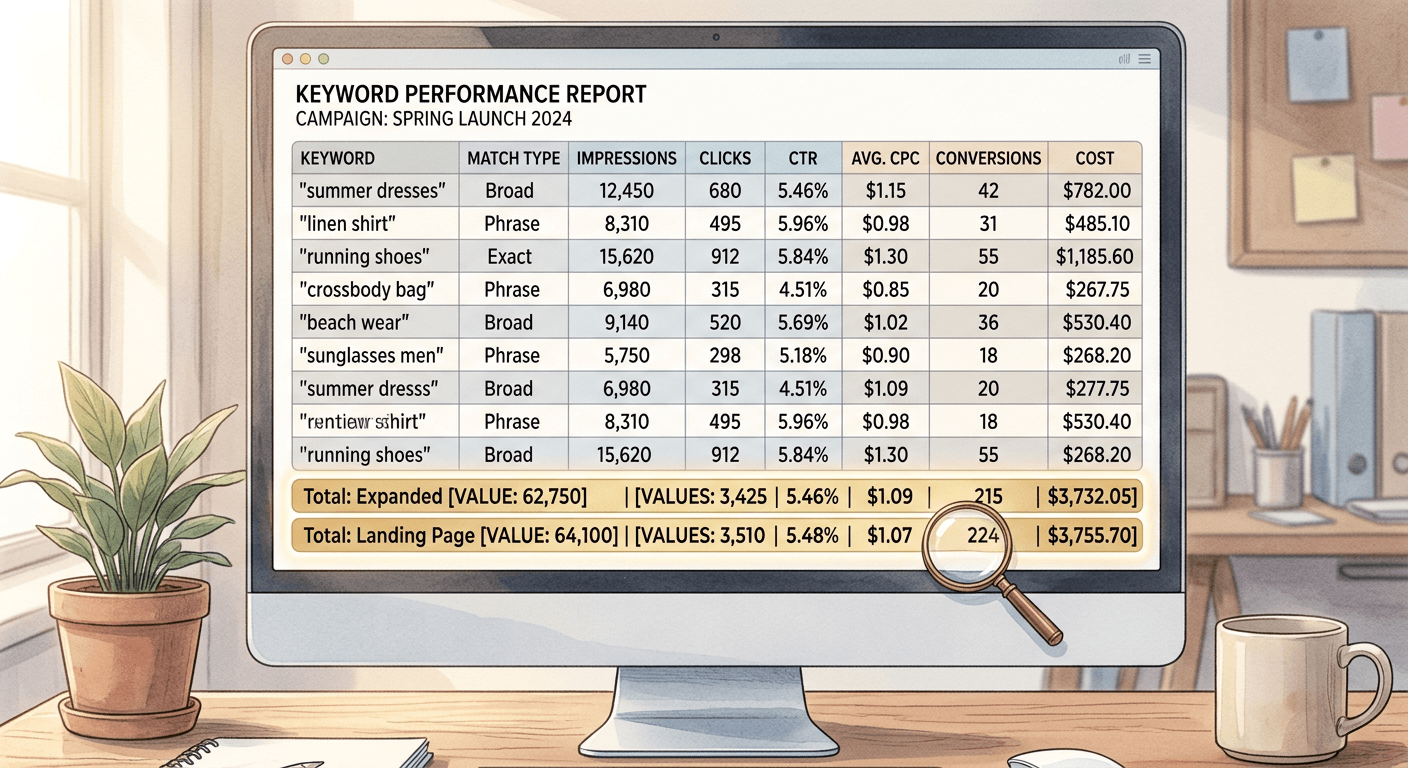
| Keyword report | Only your own keyword-level rows, with expansion traffic folded in invisibly. | Two new bottom-of-report rows: "Total: AI Max expanded matches" and "Total: AI Max landing page matches". |
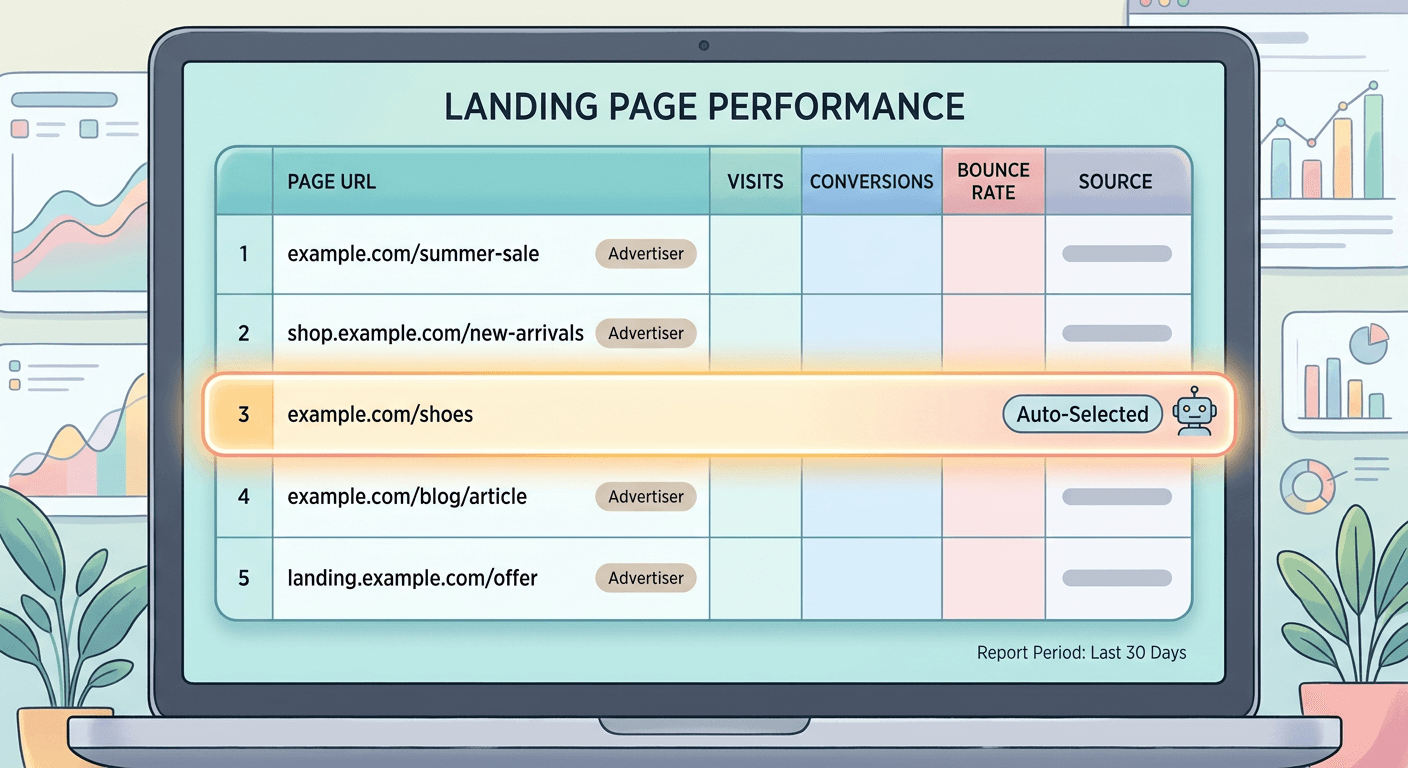
| Landing Page report | No indication of who chose a given URL for a click. | New "Selected by" column, showing "Automatically selected" for pages AI Max's Final URL expansion picked on its own. |
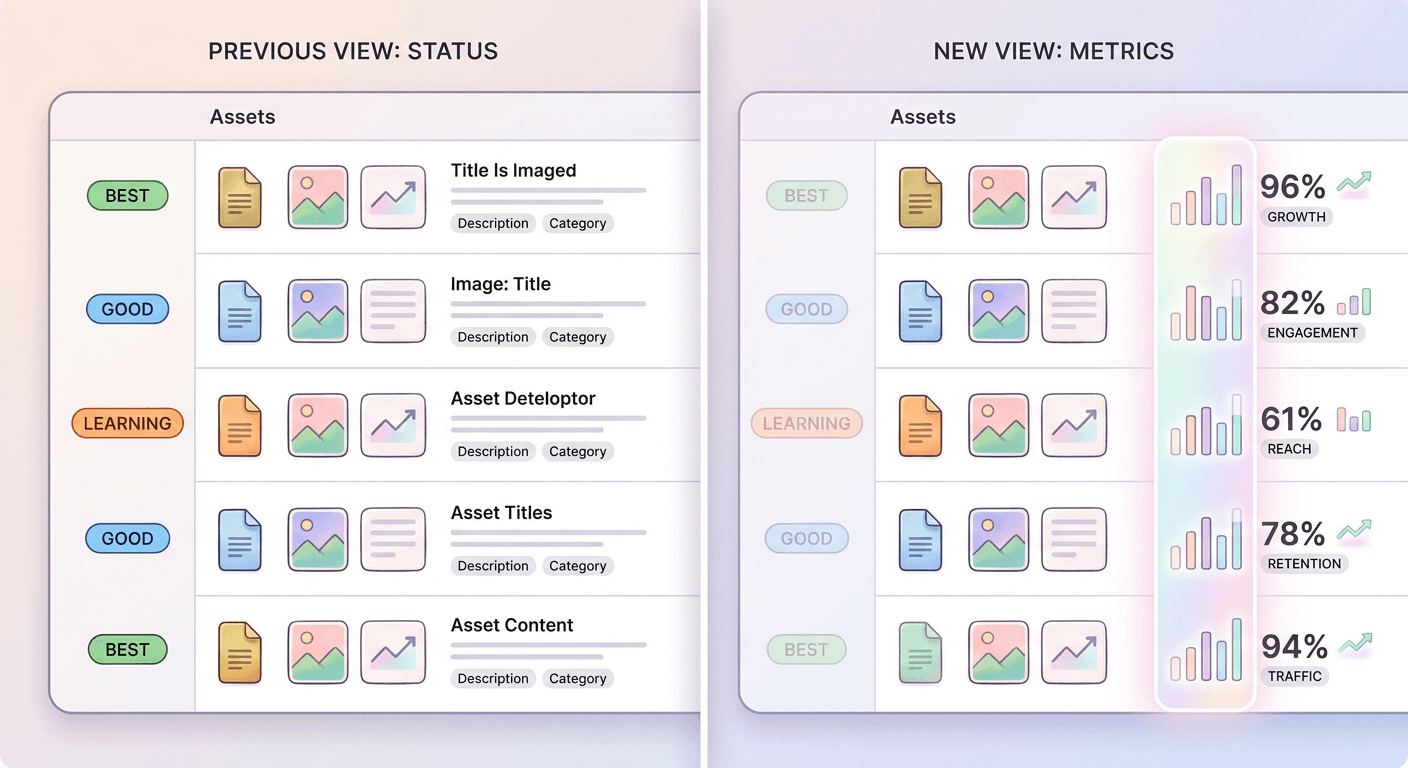
| Asset report (Search & Display) | "Performance label" column showing Pending, Learning, Good, Best, or Low for each asset. | Column returns empty for Search and Display. Full per-asset performance statistics replace it. Performance Max and Demand Gen are unaffected. |
| Performance Max Network segment | A single lumped "Cross-network" value covering all inventory. | The specific channel actually served: Search, Search Partners, YouTube, Display, Gmail, Discover, or Maps. |
What Triggers This Reporting Change, and When It Actually Lands
The reporting changes in this post are a direct downstream effect of the campaign migration Miraflow covered in our earlier piece on the AI Max auto-upgrade, so it is worth being precise about the two different clocks running here, because they are not the same clock. The campaign migration itself, Google converting existing Search campaigns that use the campaign-level broad match setting or Automatically Created Assets into AI Max, runs across the full month of September 2026, campaign by campaign, with Dynamic Search Ads campaigns following later on a separate February 2027 timeline. The reporting layer is a different thing. It is the schema underneath every report you already pull, and Google's own documentation and third-party reporting-tool tracking point to the bulk of these specific column and row changes landing around September 21, 2026, once enough of the underlying campaign migration had actually happened for the new data to exist.
That distinction matters practically. If your account had a Search campaign running campaign-level broad match on September 5 and it got migrated to AI Max that week, you may have started seeing populated Sources data and AI Max keyword rows days before a colleague whose account got migrated on September 25 sees anything different at all. The reporting change is not a single global switch that flips for every advertiser at once. It follows the campaign migration schedule, campaign by campaign, and an account with a mix of already-migrated and not-yet-migrated Search campaigns will show a genuinely mixed picture in its reports for a few weeks, some campaigns with the new columns fully populated, others still showing the old blank or default state because AI Max has not touched them yet.
Who actually sees these changes follows the same logic as the underlying migration. If your account only ever ran manual exact and phrase match keywords with Automatically Created Assets turned off, your Search campaigns were never swept into AI Max, and your Search Terms report, Keyword report, and Landing Page report keep behaving exactly as they always did, no new columns, no new rows, nothing to relearn. But two of the six changes covered here apply more broadly than the Search-only migration would suggest. The Asset Performance Label change touches every Search and Display campaign in every account, migrated to AI Max or not, because it is a change to how Google reports on assets generally, not a byproduct of the AI Max rollout specifically. And the Performance Max Network breakdown change touches every Performance Max campaign in every account, since Performance Max was never part of the Search-campaign AI Max migration in the first place, it is a separate campaign type getting its own, unrelated reporting upgrade that happened to land in the same rough window. Treat this post as two related but distinct stories: four Search-side reporting changes tied directly to the AI Max migration, and two changes, the Asset Label and the Performance Max Network breakdown, that are riding alongside it on a similar timeline without being caused by it.
An edge case worth flagging early: agencies and in-house teams pulling reports through the Google Ads API rather than the UI will see these changes differently than someone clicking through the web interface. The API exposes the underlying segments.search_term_match_source enum directly, and any script or dashboard built to parse that field by name needs to handle the new enum values the same week the UI starts showing the new Sources column, not on its own separate schedule. If your reporting stack runs through a script, Ads Editor bulk export, or a third-party dashboard tool, treat this the same way you would treat any other API version bump: check it against the new schema before assuming your existing pulls still mean what they used to mean.
The New Search Terms Report Columns, Explained in Depth
This is the change with the most day-to-day impact, because the Search Terms report is the one most advertisers already check weekly to decide what to add as a negative keyword or what to promote into its own ad group. Two things changed here at once, and they are easy to conflate if you only skim the release notes.
The first change is a new column, generally labeled Sources in the Google Ads UI and reported in detail by Search Engine Land shortly after it began rolling out, that you have to add to your default view yourself the same way you would add any other optional column. Before this change, a search term either matched one of your keywords, with some flexibility for close variants, or it did not show up as a distinct row at all. After this change, for any campaign running AI Max, the Sources column tells you specifically which mechanism actually produced that match. In the UI, the two values you will see most often are Landing pages and URL inclusions, meaning AI Max looked at your site content or a page you explicitly included and matched the search to that page without any keyword being involved at all, and AI Max expanded matches, meaning the system took one of your actual keywords and stretched it into a related search term the way broad match always did, just with a more current relevance model behind the decision. Underneath the UI, the Google Ads API exposes this same distinction through the segments.search_term_match_source field, with enum values including AI_MAX_KEYWORDLESS for the landing-page-driven matches and AI_MAX_BROAD_MATCH for the keyword-expansion matches, alongside older values like ADVERTISER_PROVIDED_KEYWORD, DYNAMIC_SEARCH_ADS, and PERFORMANCE_MAX that already existed for other match sources.
The second, related change is that AI Max now shows up as its own selectable match type in the Search Terms report, alongside Broad match, Phrase match, and Exact match. You can filter the report down to Match type equals AI Max and see nothing but the traffic AI Max itself is responsible for, cleanly separated from whatever your manually managed keywords are still doing in the same campaign. This matters because before this change, a campaign running both manual keywords and AI Max's expanded matching showed everything blended together in one match-type bucket, and there was no clean way to isolate which share of spend and conversions came from the AI-driven expansion versus your own keyword list.
Here is a concrete scenario that shows why this actually changes what you do differently, not just what you see. Say a home services business runs a Search campaign for "emergency plumber [city]" with AI Max enabled, and the Search Terms report shows a spike in impressions for "24 hour plumbing near me" and "burst pipe repair tonight." Before this reporting change, you would see those terms and have to guess whether they came from your own keyword expanding naturally, from a page on your site matching, or from something else entirely, with no reliable way to tell without exporting raw data and cross-referencing manually. After this change, the Sources column tells you directly: if it says AI Max expanded matches, that traffic traces back to your actual keyword, "emergency plumber," being stretched by AI Max's broad match logic, and tightening your keyword list or adding a negative keyword is the right lever to pull if the traffic is low quality. If it says Landing pages and URL inclusions instead, that traffic came from AI Max reading your site content directly, meaning the fix is not a keyword change at all, it is either a URL inclusion or exclusion, or a look at whether that specific page on your site should really be eligible to catch that kind of search in the first place. Reading the wrong column and pulling the wrong lever, editing keywords when the real driver was a landing page match, is exactly the kind of mistake this new column exists to prevent, and it is also exactly the kind of mistake advertisers make in the first few weeks before they internalize what the column is actually telling them.

There is also a genuinely useful combined view sitting one click away from the standard Search Terms report, currently labeled Search terms and ad combinations in the UI, though Google's own help documentation on AI Max reporting notes it carried an earlier name, Search terms and landing pages from AI Max, before being renamed and expanded. This view does something the standard report never did for any match type: it shows the actual search term next to the specific ad headlines and the specific landing page URL that were actually served for that impression, all in one row. In the API, the equivalent resource is the ai_max_search_term_ad_combination_view, described in Google's own developer documentation as the most granular reporting resource available for AI Max campaigns. Before this view existed, matching a search term back to the exact creative a searcher actually saw required cross-referencing several separate reports and making educated guesses about which ad variant was live at the time. Now it is one row, one lookup. For an advertiser auditing brand safety, checking whether a sensitive search term triggered an inappropriate headline, or just trying to understand why a particular search term converts unusually well or unusually poorly, this combined view answers a question the Search Terms report alone genuinely could not answer before.
The edge case worth knowing here: Dynamic Search Ads and Performance Max search term matching get their own distinct values in that same underlying enum, DYNAMIC_SEARCH_ADS and PERFORMANCE_MAX respectively, separate from the two AI Max values. If you are looking at a Search Terms report across an account that still has some legacy DSA campaigns not yet migrated, alongside campaigns already on AI Max, you will see all of these values sitting side by side in the same Sources column, and it is worth actually reading which one applies to which row rather than assuming every automated match is AI Max just because AI Max is the newest name in the list.
The New Keyword Report AI Max Summary Rows
The Keyword report picked up two new aggregate rows that sit at the bottom of the report, below your normal keyword-by-keyword breakdown, once a campaign is on AI Max. They are labeled Total: AI Max expanded matches and Total: AI Max landing page matches, and they mirror the same two-way split as the Sources column above, just rolled up into a single summary number per campaign instead of broken out search term by search term.
Total: AI Max expanded matches sums the traffic and performance from every search term that traces back to one of your actual keywords being stretched by AI Max's matching logic, the same mechanism as legacy broad match, just running on a newer relevance model. Total: AI Max landing page matches sums the traffic that came from AI Max reading your site content or an included URL directly, with no keyword involved in the match at all. Together, these two rows let you answer a question that used to require exporting the full Search Terms report and manually summing rows yourself: for this campaign, how much of my total volume is coming from my own keyword list being expanded, versus coming from AI Max matching my site content on its own initiative, with no keyword in the loop whatsoever.
The scenario where this actually changes a decision: imagine a retailer running a Search campaign with fifteen manually chosen keywords, now on AI Max, and the campaign's overall conversion volume looks healthy month over month. Without these two summary rows, that health could be coming from the fifteen keywords doing what they always did, in which case AI Max's expansion is adding relatively little on top, or it could be coming almost entirely from Total: AI Max landing page matches, meaning the real engine driving volume is AI Max reading the site directly, and the fifteen keywords the account manager has been carefully bidding on and adjusting are actually a minority contributor to the campaign's real performance. Those are two very different pictures of the same top-line number, and they call for different next moves, tightening or expanding the keyword list in the first case, auditing which pages are getting picked up by landing page matching and whether those pages deserve more or less eligibility in the second.
The most common misreading of these two rows, worth naming here since it shows up again in the mistakes section further down, is treating them as if they represent brand-new search volume that did not exist before AI Max. They do not. They are a reclassification of traffic that, on a pre-AI-Max campaign, would have shown up as ordinary broad match or DSA-style matching with no separate label at all. A campaign's total keyword-report volume should not jump simply because these two new rows appeared, since the underlying traffic was already being counted somewhere in the report before, just without this specific two-way split attached to it.
The Landing Page Report's New "Selected By" Column
The Landing Page report gained a column labeled Selected by, and it exists specifically to answer a question that Final URL expansion, one of the three capabilities bundled into AI Max, made genuinely ambiguous for the first time: when a click landed on a particular page, did the advertiser's own targeting choose that page, or did AI Max choose it independently.
Before Final URL expansion existed as a mainstream Search feature, this question barely needed answering, because a click on your Search campaign almost always landed on the single final URL you explicitly set at the ad or keyword level. Final URL expansion changes that by letting AI Max send a click to whatever page on your domain it judges as the best match for that specific search, a product page three clicks deep instead of your homepage, for instance, even when you never explicitly pointed an ad at that page. That is a genuinely useful capability when your site has the right page buried somewhere a static final URL would never reach, but it also means the Landing Page report started aggregating performance data across pages you never deliberately chose to advertise, mixed in with the pages you did choose, with no way to tell them apart. The new Selected by column fixes exactly that gap. For a URL that AI Max picked through Final URL expansion, the column reads Automatically selected. For a URL you explicitly set as a final URL or an included URL, the column reflects your own targeting instead.
A concrete scenario worth walking through: a software company runs a Search campaign pointed at its main pricing page as the sole final URL, with Final URL expansion turned on because a rep recommended it during the AI Max migration. Two months later, the Landing Page report shows meaningful conversion volume attributed to a specific integrations page that nobody on the marketing team remembers ever setting as a target. Without the Selected by column, that would look like a mystery, or worse, like a tracking error worth filing a support ticket over. With the column in place, it reads clearly as Automatically selected, meaning AI Max independently decided that page was the better match for a specific class of search, likely something like "does [product] integrate with [tool]," and sent traffic there instead of the pricing page. That is not a bug. It is the feature working as designed, and the correct response is to actually look at that integrations page and make sure it holds up as a landing page for paid traffic, has a clear call to action, loads fast, matches the ad's messaging, rather than assuming the pricing page is still doing all the real work in the campaign.
The edge case to watch for here involves URL exclusions. If you have specific pages on your site you never want Final URL expansion to send traffic to, an outdated blog post, a page mid-redesign, a support article with no conversion path, those need to be set explicitly as URL exclusions inside the AI Max settings, not just left alone on the assumption that AI Max would naturally avoid them. The Selected by column tells you after the fact that AI Max chose a page, but it is not a permission gate stopping that page from being chosen in the first place. Reviewing the Landing Page report with Selected by visible is exactly how you would catch an unwanted automatic selection early enough to add that page to your exclusion list before it accumulates meaningful spend behind it.
The Asset Performance Label Disappearing for Search and Display
This is the change most likely to alarm an advertiser who has not read anything about it, because it looks, at a glance, like Google quietly stopped tracking asset performance altogether. It has not. Google has retired the old Performance label column, the one that used to show a value of Pending, Learning, Good, Best, or Low for each headline, description, or image asset, specifically for Search and Display campaigns, and that column now returns empty for those two campaign types going forward. Performance Max and Demand Gen campaigns are unaffected and continue to return the label as before.
The reasoning behind the retirement is worth understanding rather than just accepting, because it changes what you should actually do about it. The old Performance label was a relative, benchmarked rating, it told you how one asset performed compared to other assets of the same type within the same ad, a simple ranking rather than a real number. Google's own documentation frames the change as a consequence of full performance statistics now being available for each individual asset, meaning the actual underlying metrics, impressions, clicks, conversions, conversion rate, for each asset are exposed directly, rather than being compressed down into a five-tier label. In principle, this is more information, not less. A rating of Good told you an asset was doing fine relative to its siblings but nothing about its actual click-through rate or cost per conversion. The real numbers tell you both, and let you compare an asset's performance against a specific target rather than just against the other assets sitting in the same ad.
In practice, this transition creates a real gap for any advertiser or agency that built dashboards, client reports, or internal alerting around the old label column specifically. A report that used to say "flag any asset rated Low" now returns nothing to flag, not because every asset suddenly became fine, but because the column that dashboard was reading from stopped populating for Search and Display. If your reporting stack pulls that specific field, the fix is not complicated, switch to filtering and sorting on the actual performance metrics, conversion rate, cost per conversion, click-through rate, directly, the same way you likely already do for keywords, but it does require someone to actually go make that change rather than assuming the old report still works. This is exactly the kind of gap that tends to sit unnoticed for weeks, since a dashboard showing "0 assets flagged" looks like good news rather than a broken query, until someone eventually asks why a genuinely underperforming asset never got caught.
A related scenario shows why this matters more now than it might have a year ago. AI Max's text customization and Final URL expansion both lean on your existing asset library to generate headlines and pick landing pages, which means asset quality now has a more direct line to Search campaign performance than it used to for advertisers who were not previously running Dynamic Search Ads. A Search account that just migrated to AI Max, at the same moment the Performance label column went blank, is in exactly the position where actually understanding which assets are pulling their weight matters most, right when the easy at-a-glance signal disappeared. The fix is the same either way, work from the real performance numbers instead of the old label, but the timing makes it worth doing sooner rather than treating it as a low-priority cleanup task.
The Performance Max Network Breakdown: From One Number to Seven
Performance Max campaigns just got a genuinely useful reporting upgrade that has nothing to do with AI Max for Search specifically, but landed in roughly the same window and deserves equal attention here, since it is arguably the single most consequential change in this entire post for anyone running meaningful Performance Max spend. Where the Network segment used to return a single lumped value, Cross-network, for essentially all Performance Max traffic, it now reports the specific channel the ad actually served on: Search, Search Partners, YouTube, Display, Gmail, Discover, or Maps.
The old Cross-network value was never really a lie, Performance Max genuinely does run across all of those surfaces simultaneously, but it was close to useless for the specific question most advertisers actually wanted answered, which channel is actually driving my results. A single Performance Max campaign that used to show one Cross-network row with one blended set of metrics now becomes up to seven separate rows, one per channel that actually served an impression, each with its own real numbers. This is not a small formatting change. Any existing filter, saved report, or automated script built around Network equals Cross-network will simply stop returning Performance Max data after this change, since that value no longer appears for Performance Max at all, which is worth checking immediately if you have any automation depending on it.
Here is a worked example of why the breakdown actually matters, not just as a reporting curiosity but as a genuine strategic input. Picture a mid-sized ecommerce advertiser running a single Performance Max campaign that, under the old Cross-network reporting, showed a blended cost per acquisition of $38 and a healthy return on ad spend across the whole campaign. That single number was the entire picture available. Once the same campaign's data gets broken out by actual channel, a realistic split might look like this: Search carrying the largest share of conversions at a genuinely strong $22 cost per acquisition, Display contributing a meaningful chunk of impressions but a much weaker $61 cost per acquisition, YouTube sitting in the middle at $40, and Gmail, Discover, and Maps together contributing a small single-digit percentage of total conversions at costs all over the map, some efficient, some not. The blended $38 figure was mathematically accurate, but it was hiding the fact that Search was quietly subsidizing a much weaker Display performance underneath it, and an advertiser who assumed Performance Max was performing evenly across its full reach would have had no way to know that, or to make an informed decision about whether that specific mix was one they actually wanted, versus one they should try to shift with asset changes or bidding adjustments.
The practical implication is that channel-mix assumptions built during the Cross-network-only era need re-baselining now that the real split is visible, not treated as settled just because the campaign's overall numbers have looked consistent for months. A campaign that has run for a year with a stable blended ROAS could easily have a channel mix that shifted meaningfully underneath that stable top-line number, Google's own automated bidding continuously reallocates spend across channels based on where it is finding results, and the old Cross-network reporting had no way to show you that reallocation happening even as it occurred. The new breakdown is the first real chance most Performance Max advertisers have had to actually see that shift instead of inferring it indirectly from asset group performance or guessing based on general Performance Max behavior described in a blog post.
This pairs naturally with a broader look at how Performance Max asset groups are actually tested and optimized once you can see the real channel split behind them, which Miraflow has covered from a couple of different angles, including structured asset experiments for Performance Max campaigns and a more focused look at running proper A/B tests on Performance Max assets. Neither of those pieces could account for the channel-level split at the time they were written, since the breakout reporting was not yet available, but the testing methodology in both holds up well once you layer the new Network data on top, since you can now check whether a creative change that looked like a win in blended reporting was actually a win on the specific channel where that asset type gets served, YouTube video assets against the YouTube breakout specifically, for instance, rather than against the whole campaign's blended number.
The Maps channel breaking out on its own is particularly relevant for any advertiser running Performance Max with a real physical storefront, since a slice of conversions that used to be invisible inside the blended Cross-network figure is now visible as its own line specifically tied to nearby, map-driven intent. Miraflow's earlier piece on optimizing Performance Max for local customers and store sales is worth revisiting with this new Maps row in hand, since a store-sales-focused campaign can now show, in real numbers, exactly how much of its performance is coming from that local, map-driven surface rather than being folded into a generic blended average the way it always used to be.

An edge case worth flagging for retailers specifically: channel-level Performance Max data is only available going back to a fixed start date, meaning a year-over-year comparison pulling channel breakdowns will show real data for recent periods and nothing usable for the same period last year. If your reporting cadence includes year-over-year Performance Max comparisons, plan around that gap rather than being surprised when last year's column comes back empty for the new channel fields specifically, even though the old blended Cross-network number is still there in the historical data for that same period.
Common Mistakes Advertisers Make When This Reporting Change Lands
The single most common mistake is assuming a blank Asset Performance Label column means Google stopped tracking asset performance for that campaign entirely. It does not. The label itself was retired for Search and Display, but the actual underlying performance data, impressions, clicks, conversions, cost per conversion, for every individual asset is still there and, if anything, more complete than the old five-tier label ever was. The fix is simple once you know it: stop looking for the label column and start sorting the asset report by the real performance metrics directly, but plenty of advertisers will spend real time worried that a tracking break happened before realizing the label was simply retired on purpose.
The second mistake is misreading the new Total: AI Max expanded matches and Total: AI Max landing page matches rows in the Keyword report as brand-new, additional search volume layered on top of what a campaign was already getting. They are not additional volume. They are a reclassification of traffic that was already happening and already being counted, now broken out with a label attached that did not exist before. A campaign's total volume should not meaningfully jump simply because these rows appeared in the report, and an account manager who reports a volume increase to a client based on these new rows appearing, without checking whether total campaign volume actually changed, is very likely reporting a change in visibility as if it were a change in performance.
The third mistake, already covered above but worth repeating here because it is genuinely the highest-stakes one, is not re-baselining Performance Max channel-mix assumptions once Cross-network splits out into real per-channel numbers. A blended metric that looked stable for months can be masking a channel mix that shifted substantially underneath it, and treating the new breakdown as a nice-to-have curiosity rather than an input worth actually reviewing means missing the first real opportunity most advertisers have had to see what Performance Max was actually doing with their budget all along.
A fourth, more subtle mistake is checking the new Sources column or Selected by column once, right after the migration, and treating that single check as sufficient going forward. Both of these reflect ongoing, dynamic decisions AI Max keeps making as your site content changes, your keyword list evolves, and your promotions rotate. A landing page that AI Max was not selecting in September could easily become one it starts selecting in November if you publish a new page that better matches a common search pattern, and a Sources split that looked mostly keyword-driven at migration time could shift toward landing-page-driven matching later as AI Max's model gets more signal from your site. Treating this as a quarterly check rather than a one-time audit item is the difference between actually using these new columns and just having glanced at them once.
A fifth mistake, specific to agencies and larger accounts, is not communicating these reporting changes to clients or stakeholders before they notice the differences themselves. A client who logs into their own Google Ads account and sees a blank Performance label column, or a Performance Max campaign that suddenly shows seven rows instead of one, without any warning, is reasonably going to assume something broke on the agency's end. A short, proactive note explaining what changed and why, essentially a condensed version of this post, costs a few minutes to send and heads off a much longer, more anxious conversation later.
Getting Your Creative Ready for What These Reports Actually Reveal
Once you can see, channel by channel and match-source by match-source, which parts of an AI Max or Performance Max campaign are actually carrying performance, the natural next question is whether the assets feeding the weaker parts of that mix are the problem, or whether the mix itself needs a strategic change. Either way, that usually means producing new creative faster than a traditional production cycle allows, especially once you are re-baselining a channel-level Performance Max mix that showed a weaker Display or YouTube segment than the blended number implied.
Miraflow's AI Image Generator is built for exactly this kind of fast iteration, text-to-image, image-to-image editing, and inpainting to adjust just the part of an existing asset that needs to change, without waiting on a design queue to produce a handful of new variations to test against a channel that just revealed itself as underperforming. For campaigns where the weaker channel turns out to be YouTube specifically, once the new Performance Max Network breakdown makes that visible, Miraflow's Cinematic AI Video Generator produces short cinematic clips suited to exactly that kind of asset group, without the lead time of booking a video shoot. Both tools work directly inside the browser, which matters when a reporting change surfaces a gap you want to act on this week, not next quarter after a production timeline clears.
If your account's Search campaigns are also touching related recent Google Ads changes, tighter product data requirements covered in Miraflow's piece on product value optimization for Shopping and Performance Max campaigns, the phrase and exact match behavior shifts discussed in Google's AI Mode phrase match testing, the removal of manual language targeting covered in Google's language targeting changes, or the shift of legacy Display inventory covered in Google's Display-to-Demand-Gen migration, it is worth reviewing all of them together rather than in isolation, since several of 2026's Google Ads changes share the same underlying direction: less manual control over exactly how and where an ad matches, paired with better visibility into what actually happened after the fact. And if the new reporting sends you back to testing budget levels or campaign structure now that the real channel and match-source splits are visible, Miraflow's piece on running search experiments across multiple campaigns and budgets is a useful next read for setting that up properly. The reporting changes in this post are squarely on the visibility side of that trade, and using them well is the fastest way to make the reduced manual control side of the trade feel less like a loss of control and more like a shift in where the control actually sits.

Frequently Asked Questions
Do these reporting changes apply to every Google Ads account? Not evenly. The Search Terms report, Keyword report, and Landing Page report changes only appear for Search campaigns that have actually migrated to AI Max, whether voluntarily or through Google's automatic September 2026 rollout. The Asset Performance Label change applies to every Search and Display campaign in every account, migrated to AI Max or not. The Performance Max Network breakdown applies to every Performance Max campaign in every account, since Performance Max sits outside the AI Max for Search migration entirely.
Why does my Keyword report suddenly show more total volume than before? It almost certainly does not, and if it appears to, check carefully before reporting an increase. The new Total: AI Max expanded matches and Total: AI Max landing page matches rows reclassify traffic that was already happening and already counted somewhere in the report, they do not represent additional search volume that did not exist before the migration.
My Asset report shows a blank Performance label column for a Search campaign. Is something broken? No. Google retired that column for Search and Display campaigns specifically, replacing it with full per-asset performance statistics that were not previously exposed in that level of detail. Performance Max and Demand Gen campaigns still return the label as before. Switch to sorting or filtering by the actual performance metrics, conversion rate, cost per conversion, click-through rate, for Search and Display assets going forward.
Can I still see historical Cross-network data for my Performance Max campaigns? Yes, historical Cross-network totals for older date ranges remain in your reporting history, but the new per-channel breakdown, Search, Search Partners, YouTube, Display, Gmail, Discover, and Maps, is only available going back to a fixed recent start date, not retroactively across your entire campaign history. A year-over-year comparison using the new channel fields will show a gap for the prior period.
What does "Automatically selected" mean in the Landing Page report? It means AI Max's Final URL expansion feature independently chose that specific page as the best match for a given search, rather than the page being one you explicitly set as a final URL or included URL. It is worth reviewing any page marked this way to confirm it actually holds up as a good landing page for paid traffic, since you did not deliberately choose it as one.
Should I filter my Search Terms report by the new Sources column regularly, or is checking it once enough? Check it on an ongoing basis, ideally as part of whatever cadence you already use to review search terms for negative keyword opportunities. The split between AI Max expanded matches and Landing pages and URL inclusions can shift over time as your site content changes and as AI Max's own model updates, so a one-time check at migration time will go stale.
Conclusion
The AI Max migration itself got most of the coverage this year, but the reporting layer underneath it is where the practical work actually happens once a campaign is live on the new system. Knowing that a Sources column now separates AI Max's keyword expansion from its keywordless landing-page matching changes which lever you pull when a search term underperforms. Knowing that the Keyword report's two new AI Max summary rows are a reclassification, not new volume, keeps you from misreporting a stable campaign as one that suddenly grew. Knowing that the Asset Performance Label went quiet on purpose, not by accident, saves you from chasing a tracking problem that does not exist. And knowing that a Performance Max campaign's real channel mix was hiding behind a single blended Cross-network number the whole time is the kind of thing worth actually re-checking against your own account this week, not filing away as background reading.
None of these six changes require you to do anything dramatic. They require you to open the reports you already check and read them slightly differently than you did in August. Pair that with an honest look at whether the creative feeding these campaigns, the images and video assets AI Max's text customization and Final URL expansion are increasingly drawing from, is actually good enough to earn the numbers these new columns are about to show you clearly for the first time. Miraflow's AI Image Generator and Cinematic AI Video Generator are built for exactly that kind of fast follow-up, and Miraflow as a whole covers the rest of the content pipeline, script, visuals, video, thumbnail, and music, in one place, if this reporting audit turns up more than one campaign that needs fresher assets before its next review.